Metadata of DSID000001
| DeepSpace ID | DSID000001 |
| Sample ID | GSM4565823 |
| Series ID | GSE144239 |
| Platform | Visium V1 |
| Organism | human |
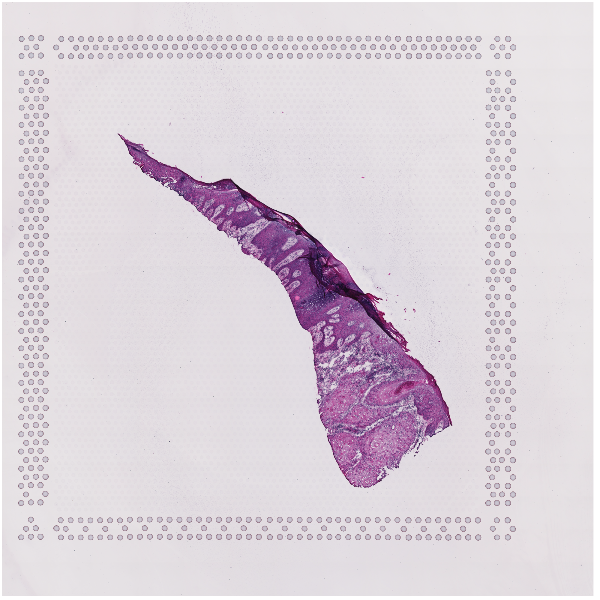
| Organ | skin of body |
| Organ Detailed | skin epidermis |
| Condition | cancer |
| Condition Detailed | squamous cell carcinoma |
| Sex | -- |
| Age or Stage | -- |
| Post Mortem | -- |
| Ethnicity or Strain | -- |
| Description | cutaneous squamous cell carcinoma; same patient as sample GSM4565824 |
| Source | GEO |
| Source URL | GSE144239 |
| PMID URL: | 32579974 |
| Date Published: | 2020-06-22 |
Location of the sample in the database
Embedding of all samples in DeepSpaceDB. The current sample is indicated as the point with a larger size. Select a spot to see it's preview information:
Information about selected sample:
Quality of this sample
Inspect various quality measures of this sample.
Ploting the spatial pattern of quality measures of this sample
Select quality measure
Plotting the average quality of this sample compared to that of other samples in DeepSpaceDB.
Plotting the quality of spots in this sample compared to all spots in DeepSpaceDB. Because of the large number of spots in DeepSpaceDB, plots take a few seconds to generate.
Image annotation
Annotation by a human expert is on the right:
Spot clustering
Visualization of spot clustering within a 2D embedding and inside the tissue. Colors represent clusters of this sample only, clusters found in the entire database, or BASS/BayesSpace domain clusters.
Choose clustering method:
Choose which clusters to display:
Clusters inside 2D embedding
Clusters inside tissue section
Spatially variable genes
singleCellHaystack was used to predict genes with differential expression patterns within the tissue space. Check our FAQ for details on gene expression units.
Spatially variable pathways
We estimated the activity of biological processes in each spot based on the expression of genes known to be involved in each process. singleCellHaystack was used to predict pathways with significant non-random patterns within the tissue. Check our FAQ for details on pathway activity units.
Cell type compositions
We predicted the cell type composition of each spot using the RCTD method. For each spatial sample, we selected a suitable reference single-cell RNA-seq data to use for this prediction. The plots below show the predicted fraction of each cell type in each spot, as well as the cell type with the highest predicted fraction in each spot.
Select cell type
Predicted cell type fractions
Top predicted cell type
Average cell composition
Tissue Explorer
Select spots of interest
Current selections
Select a set:
Number of spots in Set 1: 0
Number of spots in Set 2: 0
Select clusters:
Table expression in selections
Cell-cell Сommunication
Cell-cell communication analysis results from CellChat.
Download data
Download features.tsv.gz
Download matrix.mtx.gz
Download seurat_processed.rds
Download seurat_raw.rds
Download moduleScores.csv
Download haystack_genes.csv
Download haystack_moduleScores.csv
Download SPARKX.csv
Download BinSpect.csv
Download BASS.csv
Download BayesSpace.csv
Download CellChat.csv
Download cell_type_prediction_SPOTlight.csv
Download cell_type_prediction_RCTD.csv
Download spatial/tissue_hires_image.png
Download spatial/scalefactors_json.json
Download spatial/tissue_positions_list.csv
Download spatial/tissue_lowres_image.png
Download All Files